During the winter of 2013/2014, after I had told my brother Oklahoma would have “pleasant weather in March, April, October and November”, said that “October was by far the most pleasant month” he had experienced in Norman, and that November was very cold due to the wind.
Today, well over a year later with my brother permanently back in Melbourne and working at Monash, I had a look at the weather in Norman during the period from November 2013 to January 2014 (figures courtesy of the US National Weather Service:
 |
| Daily temperature range for Norman, Oklahoma between November 2013 and January 2014 |
What one can see is that, for the most part, the winter was colder than average. However, no day was nearly as cold as some previous
historic cold months in Oklahoma like February 1899, February 1905, January 1930, January 1940, February 1978, January 1979 or December 1983. In these months temperatures reached below 0˚F (-17.8˚C) occurred across the state, with very high wind chills. No doubt those would be dreadful to experience even compared with my 2009/2010 holiday in Japan, Helsinki and the Northeast.
 |
| Temperatures (˚C) for January (dark blue), winter (royal blue) and November to March (light blue) in Oklahoma City between 1890/1891 and 1996/1997 |
Although I cannot gain any ideal of wind chill temperatures, it is nonetheless clear than the winter of 2013/2014 was not unusually cold and that it may be
my fault for not realising the effects of wind chill in what I said to my brother about the climate. I then asked my brother about several December days shown in the top diagram which went from -0.6˚C (31˚F) to 20.6˚C (69˚F). Although my brother was travelling around Texas and New Mexico during the period from 17 to 20 December 2013, he said days going from 0˚C to 20˚C were “basically cold”, although to me 20.6˚C is shorts weather unless it is windy. However, I rebutted my brother by saying that Oklahoma city’s hot spell in February 1930 – following a severe cold wave in January – “was not jumper weather”, which can be seen from the graph below:
 |
| Oklahoma City temperatures during the winter of 1929/1930. Note the extremely cold weather from 6 January to 2 February and the very warm spell from 5 to 24 February. |
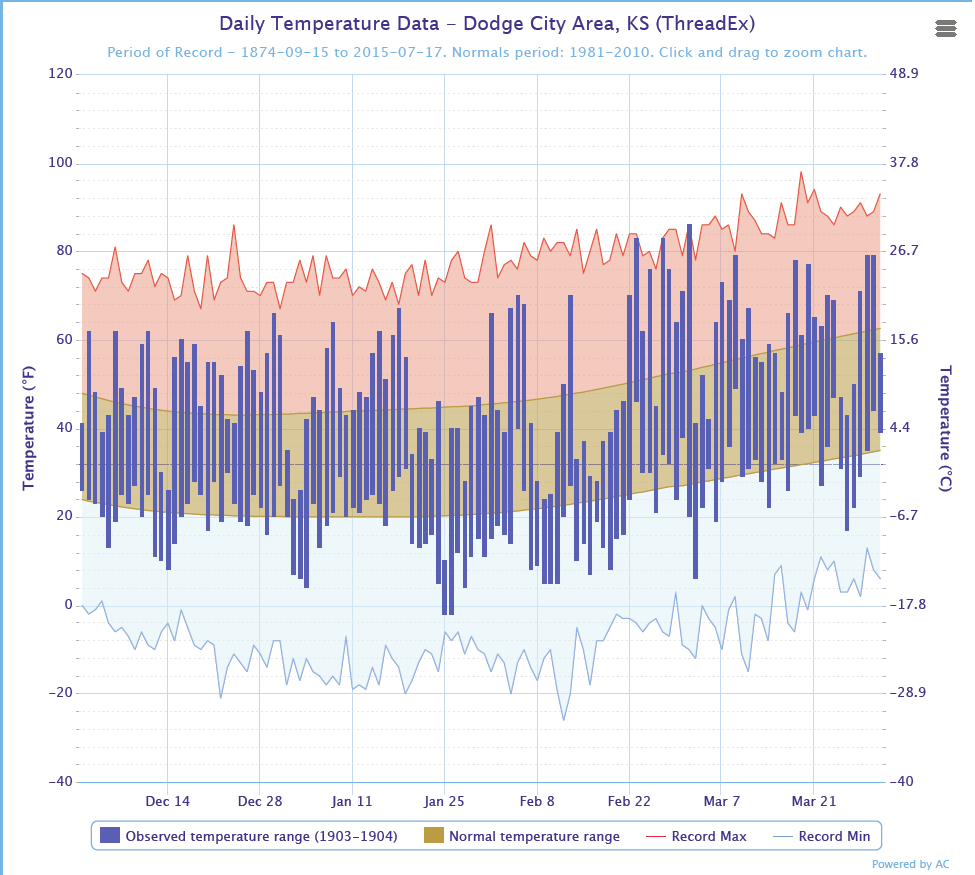
The fact that temperatures in the Great Plains during winter can change dramatically has long been known to me: Havre, Montana in the north of this region has ranged in February from an arctic -49˚C to a warm-enough-for-shorts 24˚C, which must be close to a world record for the largest range of recorded temperatures at a single station during so narrow a range of calendar dates. In February 1962, Scottsbluff, Nebraska ranged from 25˚C to minus 33˚C. In fact, temperatures under the influence of Föhn or “chinook” winds in the region can range within one day by up to 56˚F or 30˚C, as was observed in March 1904 in Dodge City, Kansas:
 |
| Daily temperatures from December 1903 to March 1904 in Dodge City, Kansas. Note the extreme diurnal temperature ranges in late February and early March – on one day Dodge City went from 86˚F to 20˚F, both hotter and colder than was reached here in Melbourne in all of March 1904. |
These figures taught me something I knew – that people should not ignore past weather as, notably in Western Australia and the Northern Territory, it can owing to the absence of Australian greenhouse emissions be vastly different from present weather. it also taught me something I did
not know – that averages and even extremes can be misleading as to how comfortable the weather is. Wet-bulb temperatures in hot, humid climates are a well-known case, but wind-chill and sunshine in cold climates can be a major problem. This is especially true in nations like the US that provide few data on actual wind-speed (though many on wind-chill temperature) and on sunshine.


No comments:
Post a Comment